Weekly Market Commentary
December 22nd, 2025
Week in Review…
Last week’s economic data offered a concentrated look at a U.S. economy in transition, with headline numbers masking deeper shifts beneath the surface.
Labor market signals were mixed. November’s hiring beat expectations, but the unemployment rate climbed to a four-year high of 4.6%, and October revisions revealed a loss of 105,000 jobs. The real story is in the details: companies are holding onto staff but cutting hours, driving the U-6 underemployment rate to 8.7% and swelling the ranks of involuntary part-time workers by 909,000. This “hours versus headcount” strategy means workers keep jobs but lose income and markets will likely be on the lookout for weaker consumer spending.
Data from the revised October nonfarm payroll indicates that the higher unemployment rate is mainly due to a loss of 162,000 federal government jobs, largely caused by deferred resignation offers. These displaced workers entered a private sector with frozen hiring, pushing the headline unemployment rate higher. Meanwhile, initial jobless claims remain low, reflecting corporate reluctance to let go of talent, but continuing claims are trending up, signaling that those who lose jobs are struggling to find new ones.
Inflation data delivered a dovish surprise, with headline CPI dropping to 2.7% (BLS). However, analysts caution that this lower-than-expected inflation report may be of “low quality,” as the reported rate could appear artificially low. Analysts specifically point to the collection of data during a period of unusually deep retail discounts and disruptions in the regular survey schedule, both factors that can temporarily suppress measured price increases and distort the true underlying inflation trend. At the same time, Average Hourly Earnings rose just 0.1% in November, indicating that labor is showing early signs of losing pricing power. Together, these reports point to easing wage-driven inflation, but the downside is clear: stagnant wages and shrinking paychecks threaten consumer demand.
Other Reports on the Radar
- University of Michigan Consumer Sentiment (December): Sentiment index fell to 52.9, near historic lows, with labor anxiety now outweighing inflation concerns
- Core Retail Sales (November, Census Bureau): Flat overall, with core sales up just 0.2%. Spending shifted toward essentials, while discretionary purchases lagged.
- Business Inventories (November, Census Bureau): Rose 0.2%, with retail inventories up 0.4%. Rising inventories could signal slowing demand ahead.
- Existing Home Sales (November, NAR): Increased 0.5% to 4.13 million units, but volume remains historically low. Median home price hit a record $409,200, erasing affordability gains from lower rates.
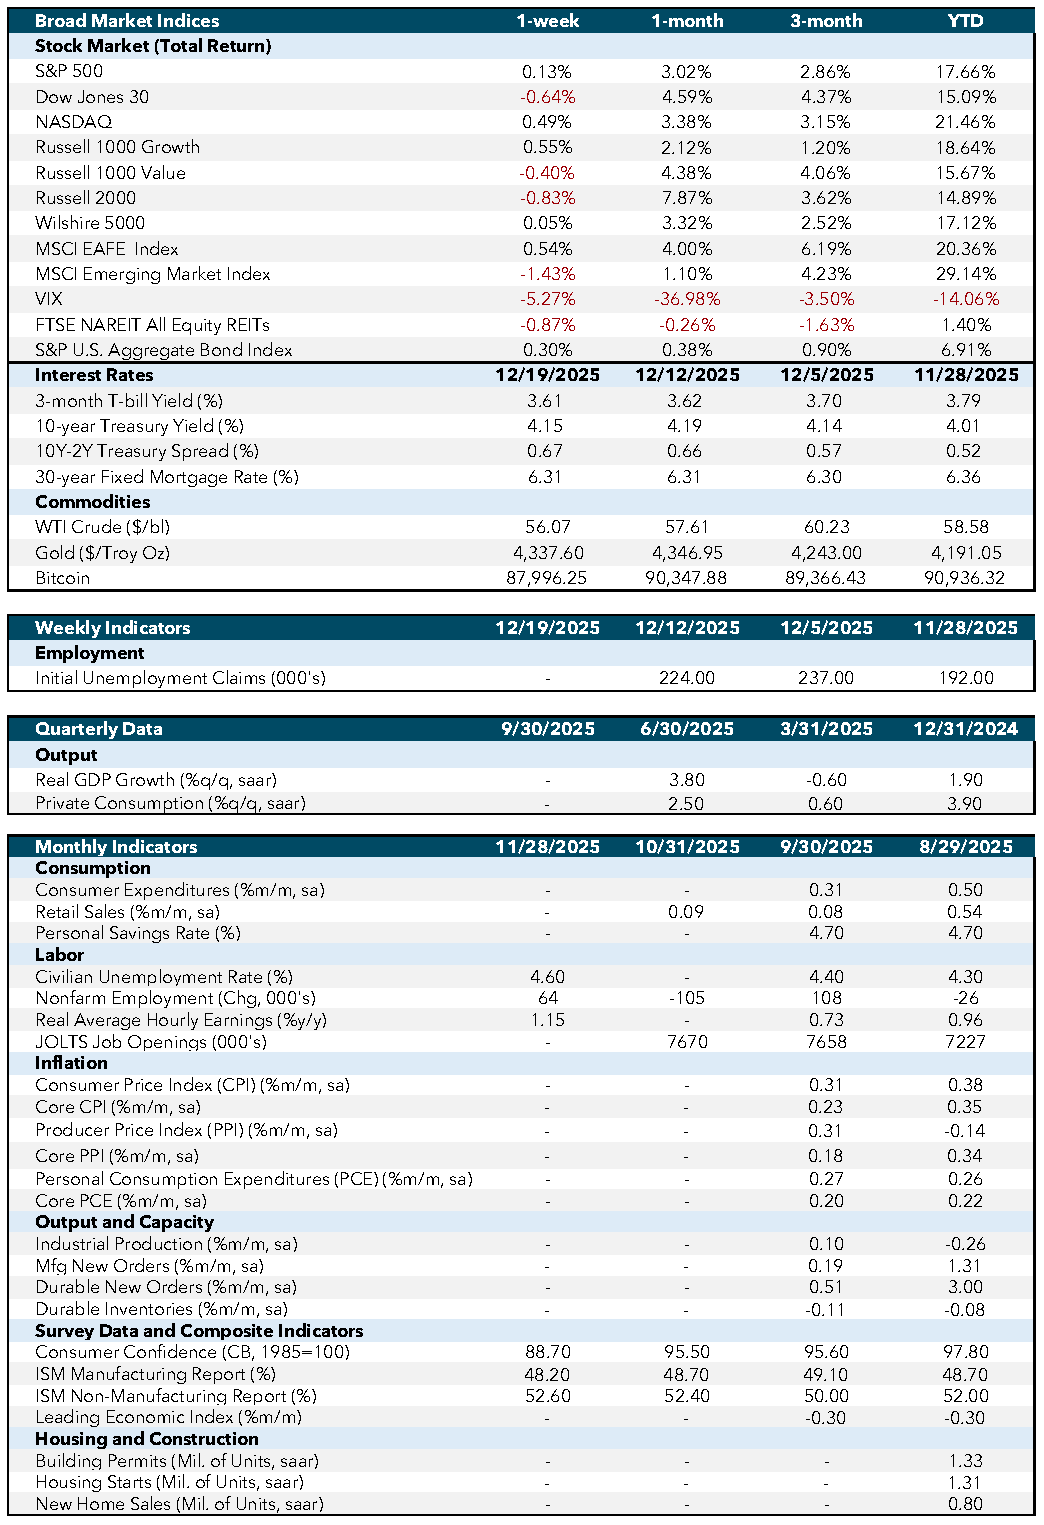
Economic and Capital Markets Dashboard
Week Ahead…

The Fed’s preferred inflation metric, Core Personal Consumption Expenditures (PCE), will be closely watched after last week’s “low quality” CPI reading. Investors will look for confirmation of a cooling trend, but any signs of distortion from holiday discounting or delayed data could temper enthusiasm for further Fed easing.
Housing market data will also be in focus, with housing starts and new home sales covering September through November. These releases will reveal whether demand is thawing or if high prices and mortgage rates continue to freeze buyers out. Any improvement in construction or sales could signal a shift, but persistent weakness would highlight ongoing affordability challenges.
Personal spending figures will offer a direct measure of consumer resilience. With wage growth stagnating and underemployment rising, November’s spending data will be scrutinized for signs that households are pulling back, especially on discretionary purchases. The Conference Board’s Consumer Confidence report will provide another perspective on household sentiment and comparing it to last week’s pessimistic University of Michigan survey will help gauge whether anxiety about jobs and the economy is broad-based.
From a business standpoint, the Industrial Production report and Core Durable Goods Orders will be important indicators of underlying momentum. Weakness here could signal that the slowdown is spreading from consumers to businesses, while any signs of strength might suggest resilience in investment and manufacturing.
Together, these reports will offer a comprehensive snapshot of inflation, consumer demand, and business activity, helping clarify the risks and opportunities as we head into 2026.
Economic Indicators:
- CPI: Consumer Price Index measures the average change in prices paid by consumers for goods and services over time. Source: Bureau of Labor Statistics.
- Core CPI: Core Consumer Price Index excludes food and energy prices to provide a clearer picture of long-term inflation trends. Source: Bureau of Labor Statistics.
- PPI: Producer Price Index measures the average change in selling prices received by domestic producers for their output. Source: Bureau of Labor Statistics.
- Core PPI: Core Producer Price Index excludes food and energy prices to provide a clearer picture of long-term inflation trends. Source: Bureau of Labor Statistics.
- PCE: Personal Consumption Expenditures measure the average change in prices paid by consumers for goods and services. Source: Bureau of Economic Analysis.
- Core PCE: Core Personal Consumption Expenditures exclude food and energy prices to provide a clearer picture of long-term inflation trends. Source: Bureau of Economic Analysis.
- Industrial Production: Measures the output of the industrial sector, including manufacturing, mining, and utilities. Source: Federal Reserve.
- Mfg New Orders: Measures the value of new orders placed with manufacturers for durable and non-durable goods. Source: Census Bureau.
- Durable New Orders: Measures the value of new orders placed with manufacturers of durable goods. Source: Census Bureau.
- Durable Inventories: Measures the value of inventories held by manufacturers for durable goods. Source: Census Bureau.
- Consumer Confidence (CB, 1985=100): Measures the degree of optimism that consumers feel about the overall state of the economy and their personal financial situation. Source: Conference Board.
- ISM Manufacturing Report: Measures the economic health of the manufacturing sector based on surveys of purchasing managers. Source: Institute for Supply Management.
- ISM Non-Manufacturing Report: Measures the economic health of the non-manufacturing sector based on surveys of purchasing managers. Source: Institute for Supply Management.
- Leading Economic Index: Measures overall economic activity and predicts future economic trends. Source: Conference Board.
- Building Permits (Mil. of Units, saar): Measures the number of new residential building permits issued. Source: Census Bureau.
- Housing Starts (Mil. of Units, saar): Measures the number of new residential construction projects that have begun. Source: Census Bureau.
- New Home Sales (Mil. of Units, saar): Measures the number of newly constructed homes sold. Source: Census Bureau.
- SA: Seasonally adjusted.
- SAAR: Seasonally adjusted annual rate.
Market Indices & Indicators:
- S&P 500: A market-capitalization-weighted index of 500 leading publicly traded companies in the U.S., widely regarded as one of the best gauges of large U.S. stocks and the stock market overall.
- Dow Jones 30: Also known as the Dow Jones Industrial Average, it tracks the share price performance of 30 large, publicly traded U.S. companies, serving as a barometer of the stock market and economy.
- NASDAQ: The world’s first electronic stock exchange, primarily listing technology giants and operating 29 markets globally.
- Russell 1000 Growth: Measures the performance of large-cap growth segment of the U.S. equity universe, including companies with higher price-to-book ratios and growth metrics.
- Russell 1000 Value: Measures the performance of large-cap value segment of the U.S. equity universe, including companies with lower price-to-book ratios and growth metrics.
- Russell 2000: A market index composed of 2,000 small-cap companies, widely used as a benchmark for small-cap mutual funds.
- Wilshire 5000: A market-capitalization-weighted index capturing the performance of all American stocks actively traded in the U.S., representing the broadest measure of the U.S. stock market.
- MSCI EAFE Index: An equity index capturing large and mid-cap representation across developed markets countries around the world, excluding the U.S. and Canada.
- MSCI Emerging Market Index: Captures large and mid-cap representation across emerging markets countries, covering approximately 85% of the free float-adjusted market capitalization in each country.
- VIX: The CBOE Volatility Index measures the market’s expectations for volatility over the coming 30 days, often referred to as the “fear gauge.”
- FTSE NAREIT All Equity REITs: Measures the performance of all publicly traded equity real estate investment trusts (REITs) listed in the U.S., excluding mortgage REITs.
- S&P U.S. Aggregate Bond Index: Represents the performance of the U.S. investment-grade bond market, including government, corporate, mortgage-backed, and asset-backed securities.
- 3-Month T-bill Yield (%): The yield on U.S. Treasury bills with a maturity of three months, reflecting short-term interest rates.
- 10-Year Treasury Yield (%): The yield on U.S. Treasury bonds with a maturity of ten years, reflecting long-term interest rates.
- 10Y-2Y Treasury Spread (%): The difference between the yields on 10-year and 2-year U.S. Treasury bonds, often used as an indicator of economic expectations.
- WTI Crude ($/bl): The price per barrel of West Texas Intermediate crude oil, a benchmark for U.S. oil prices.
- Gold ($/Troy Oz): The price per troy ounce of gold, a standard measure for gold prices.
- Bitcoin: A decentralized digital currency without a central bank or single administrator, which can be sent from user to user on the peer-to-peer bitcoin network.
This content was developed by Cambridge from sources believed to be reliable. This content is provided for informational purposes only and should not be construed or acted upon as individualized investment advice. It should not be considered a recommendation or solicitation. Information is subject to change. Any forward-looking statements are based on assumptions, may not materialize, and are subject to revision without notice. The information in this material is not intended as tax or legal advice.
Investing involves risk. Depending on the different types of investments there may be varying degrees of risk. Socially responsible investing does not guarantee any amount of success. Clients and prospective clients should be prepared to bear investment loss including loss of original principal. Indices mentioned are unmanaged and cannot be invested into directly. Past performance is not a guarantee of future results.
The Dow Jones Industrial Average (DJIA) is a price-weighted index composed of 30 widely traded blue-chip U.S. common stocks. The S&P 500 is a market-cap weighted index composed of the common stocks of 500 leading companies in leading industries of the U.S. economy. The NASDAQ Composite Index is a market-value weighted index of all common stocks listed on the NASDAQ stock exchange.
Securities offered through Cambridge Investment Research, Inc., a broker-dealer, member FINRA/SIPC, and investment advisory services offered through Cambridge Investment Research Advisors, Inc., a Registered Investment Adviser. Both are wholly-owned subsidiaries of Cambridge Investment Group, Inc. V.CIR.1225-4649